
Tytanid's BNB Chain Quarterly Report - Q2 2022
This report provides an overview of the BNB Chain ecosystem and chain performance based on on-chain indicators.
Abstract
BNB Chain, formerly known as Binance Smart Chain (BSC), was launched in September 2020. The goal of the Binance team was to provide an alternative foundation for creating smart contracts for the increasingly expensive Ethereum main network. It is a completely proprietary and independent blockchain that operates on the basis of a consensus mechanism in the Proof of Staked Authority (PoSA) model, where participants put BNB to then become network validators. The new chain developed by the Binance team is also compatible with Ethereum Virtual Machine (EVM), meaning it can leverage the pre-existing Ethereum platform development tools that have led to the huge success of this market leader in smart contract creation.
The BNB chain was created to scale the infrastructure necessary to handle a large number of extremely cheap transactions in the DeFi area without compromising speed. An additional goal of the engineers working for Binance is to provide programmability of smart contracts for entrepreneurs who want to create new projects and launch their tokens in the BNB Chain network.
Currently, there are already thousands of projects in the BNB network, of which the following initiatives deserve special mention: Era7, MOBOX, World, SecondLive and Tiny. In addition, it is worth mentioning here that PancakeSwap is still the most used dApp platform in the BNB network in the second quarter of 2022.
In the second quarter of 2022, BNB Chain is still the most used blockchain in terms of transaction volume and number of unique wallet addresses due to low transaction costs.
Key developments: Q2 2022
The BNB Chain ecosystem fund, worth USD 1 billion, continues to finance numerous projects aimed at the development and support of the BNB ecosystem.
On May 31, the BNB team successfully increased the number of validators. Currently, the network mechanism provides for a number of validators ranging from 21 to 41.
BNB Smart Chain Mainnet has been updated for the Descartes update which happened on April 1, and the Euler update was rolled out on June 9.
BNB Beacon Chain was released as open source on June 17.
Binance Bridge 2.0 was launched on April 27, which opened up the possibility for users to combine resources from each blockchain with the chain created by Binance.
In June, the team behind BNB launched its 5th 'Most Valuable Builder' program. This is named ‘MVB V: Uncharted Territory’.
BNB Sidechain was launched on June 2.
BNB ecosystem
The BNB ecosystem experienced a significant increase to over 1,400 dApps during the second quarter. The most popular applications that operate on this chain include: PancakeSwap, SecondLive, Alpaca, Finance, Venus, Mobox, Era7 and Tiny World. The broadly understood cryptocurrency community expects a $ 1 billion asset value ecosystem fund and the latest $ 500 million investment fund to help the BNB ecosystem continue to grow and develop despite the unfavorable current market environment.
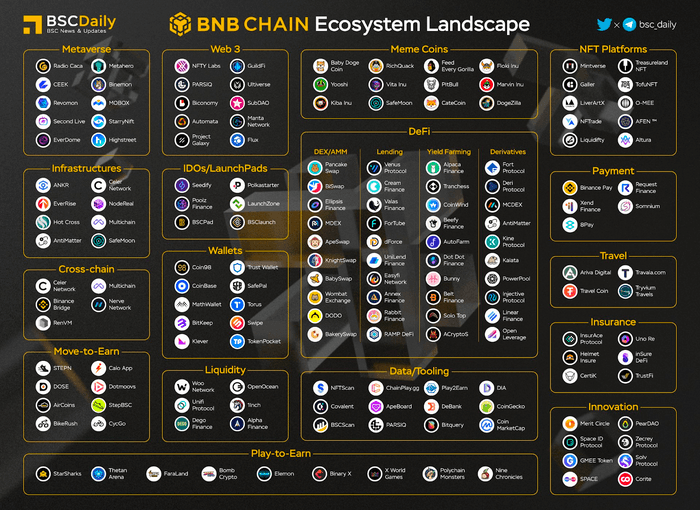
Source: BSCDaily
Tytanid Data
Daily Transactions
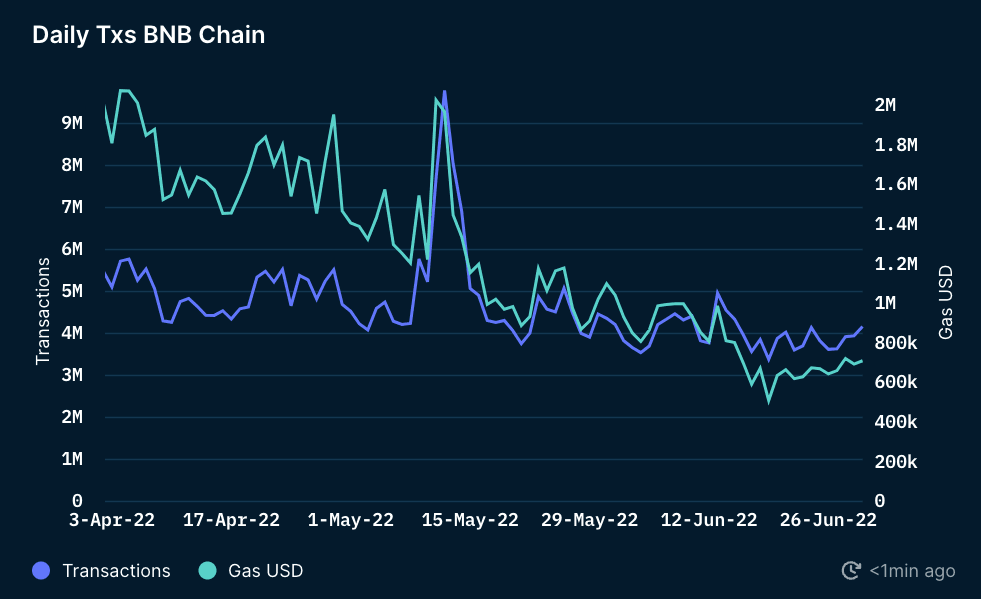
Source: Tytanid
The chart above shows that both transactions and gas continued to decline during the second quarter of 2022. According to Tytanid experts, this is due to the fact that the overall activity in all networks has decreased, while the market has continued to decline. The sudden spike between May 11 and 12 was most likely a shock effect of UST depegging and Luna's catastrophic bankruptcy.
Transactions: Ethereum vs BNB Chain
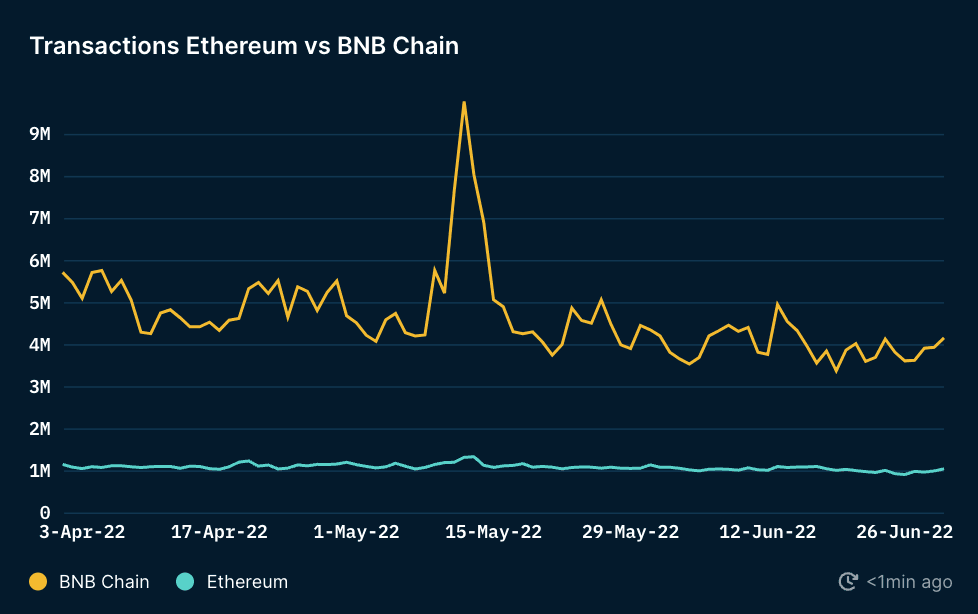
Source: Tytanid
BNB Chain is the most active smart contract blockchain in terms of the number of transactions, surpassing even the Ethereum project in this respect. Although the overall number of transactions decreased slightly during the second quarter (which can be easily explained by the overall decline in BNB activity), the total number of transactions still remained about 3-6 times higher than that of Ethereum. It is worth adding here that despite the unfavorable market conditions, the number of these transactions reached 9.8 million, and this took place during the UST depegging event on May 12. Although some of the transactions from the second quarter were made by bots, the BNB network was still doing great in this period of time.
Daily Gas Paid vs Ethereum
The data compiled in the above chart shows that the total amount of gas paid in the BNB network was still much lower than in the case of Ethereum. It is worth mentioning that although the BNB network is much cheaper and faster in terms of transactions, it is also more centralized than Ethereum. This is due to the fact that the BNB chain had only 21 active validators at the stage of Q2 2022. Consequently, the BNB Chain Developer Community has made a proposal called BEP-131. This initiative was designed to encourage and increase the number of validators for further decentralization in the BNB chain. In addition, the daily gas fee paid in USD for both networks continued to decline towards the end of the second quarter (this can be seen in detail in the next chart).
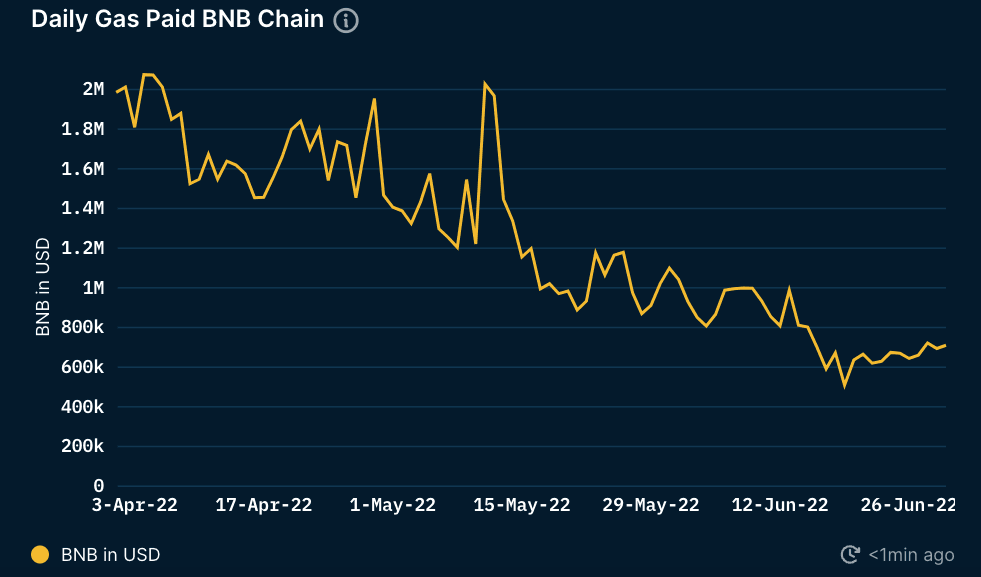
Source: Tytanid
Additionally, it's worth noting that BNB still had higher daily transactions compared to Ethereum, while maintaining significantly lower daily gas charges - an average of $ 700k for BNB and $ 5 million for ETH in the last week of Q2.
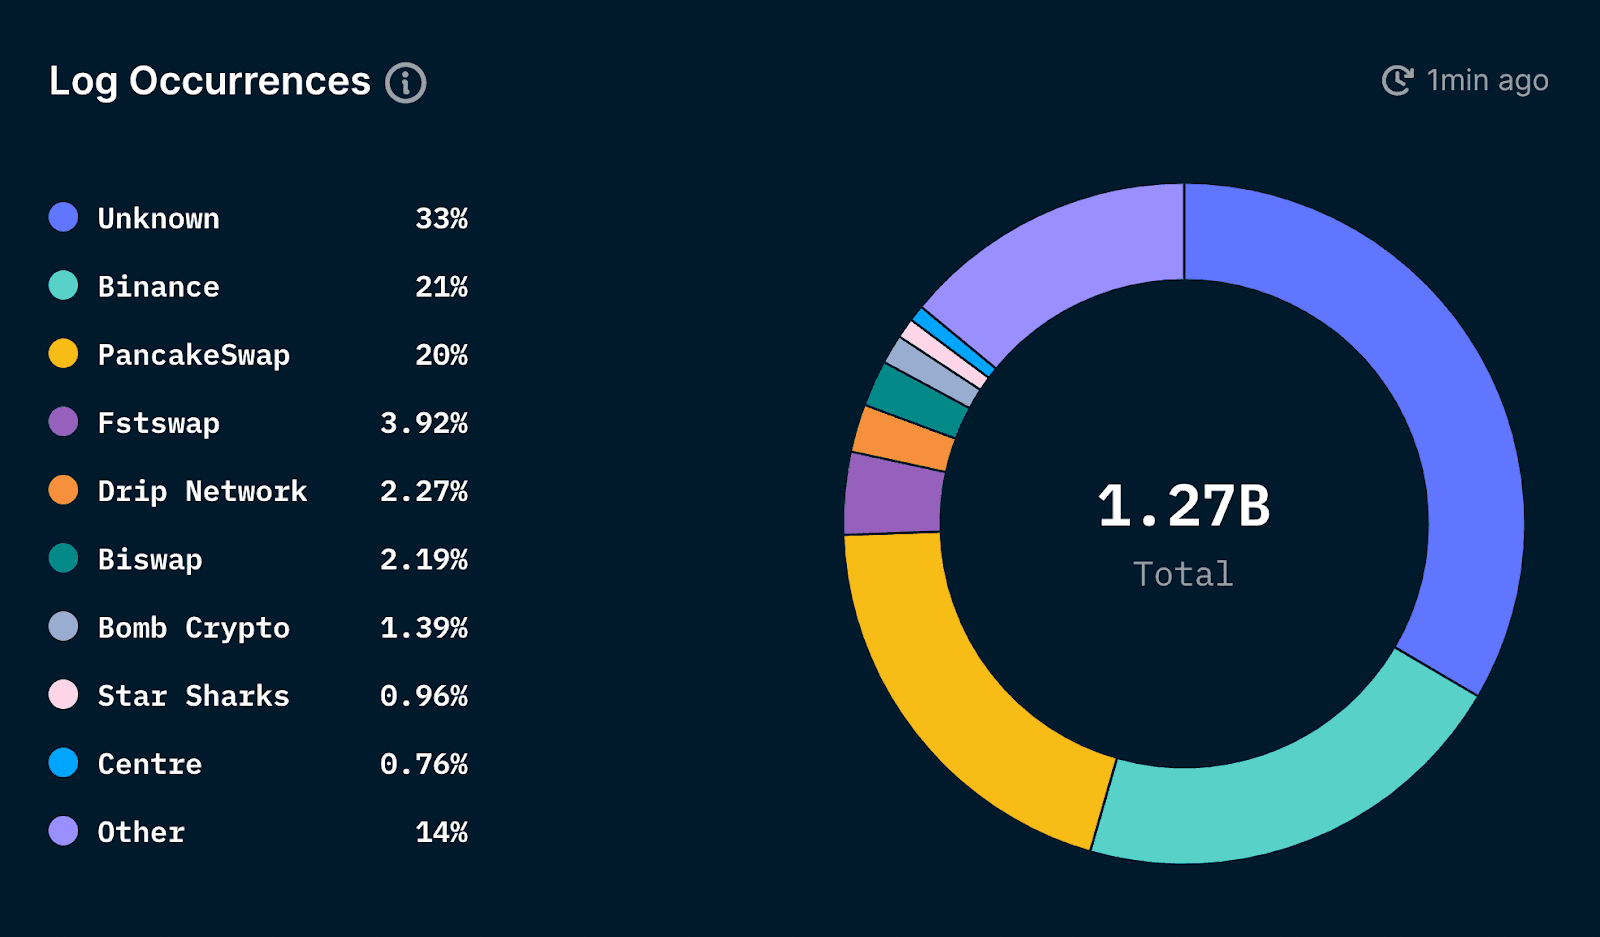
Source: Tytanid
As mentioned earlier, PancakeSwap continues to dominate in terms of share of the overall transaction volume, accounting for 20% of all transactions in the BNB chain. Other notable projects in the second quarter include Era7, SecondLive, MOBOX and Tiny World.
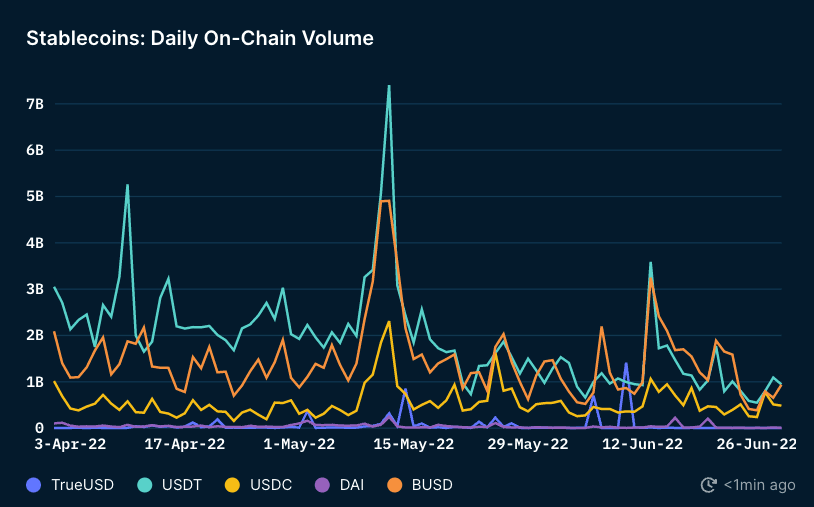
Stablecoins: Daily On-Chain Volume
Source: Tytanid
Daily Stablecoin's transaction volume in the chain is another critical indicator that can be used to gauge user activity and engagement on the BNB network. With the growing popularity of blockchain, the daily volume of trading for the stablecoin sector in the chain is also increasing, as these coins are the basic element facilitating participation in the entire ecosystem.
The data presented in the chart above shows the daily volume of trades in the BNB chain for stablecoins such as USDT, DAI, USDC, BUSD and TrueUSD. The chart above clearly illustrates that at the beginning of the second quarter, the daily BNB volume varies significantly for the various stablecoins used in this network. USDT and BUSD were the largest contributors to the overall turnover, followed by USDC, DAI and True USD. Most stablecoins reached their turnover peak on May 12. Interestingly, USDT has reached $ 7.4 billion, which is obviously related to UST depegging.
At the end of the second quarter, coins such as USDT, BUSD and USDC were relatively close to each other in the daily on-chain volume, while the USDT volume fell by as much as 87.29% from the peak. BUSD and USDC volumes fell by 80.93% and 79%, respectively. It's also worth noting that TrueUSD peaked at $ 1.4 billion in early June, but ended the quarter with a spectacular decline of around $ 1 million. This coin therefore recorded a decrease of over 99.93%.
Stablecoins: Daily Active Senders
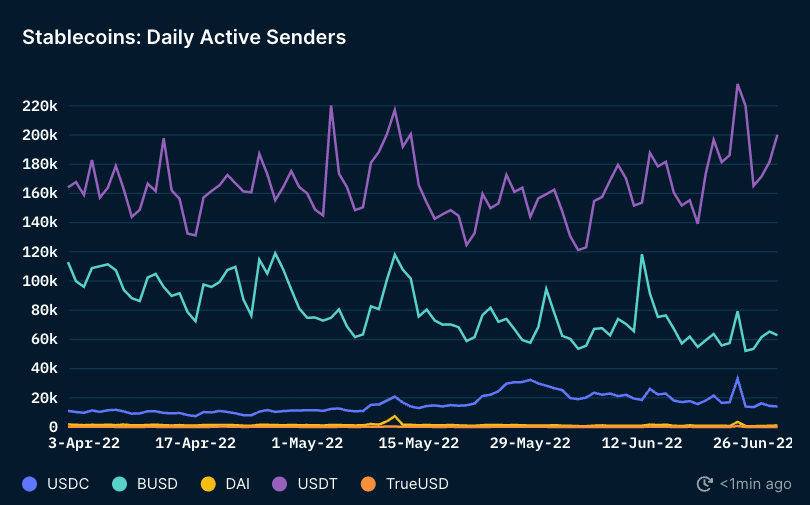
Source: Tytanid
The interpretation of the Daily Active Senders analysis shows that USDT is the stablecoin most frequently traded in the BNB chain, followed by BUSD. There was a significant difference in the number of active senders on a single day between these two specific stablecoins and all their competitors on this blockchain. The USDT continued to dominate the BUSD that started at the beginning of the first quarter, and the gap widened at the end of the second quarter. BUSD experienced a decline in active users from a peak of 120,000 senders a day to just around 60,000. On the other hand, the number of active USDT senders during the day continued to rise markedly, reaching a peak of 235,000 at the end of June. Moreover, DAI and TrueUSD continued to remain unchanged during the quarter. Interestingly, the number of active DAI senders during the day was still hovering around 1,200, while for TrueUSD it was below 200.
Ethereum Smart Money Segments on BNB Chain
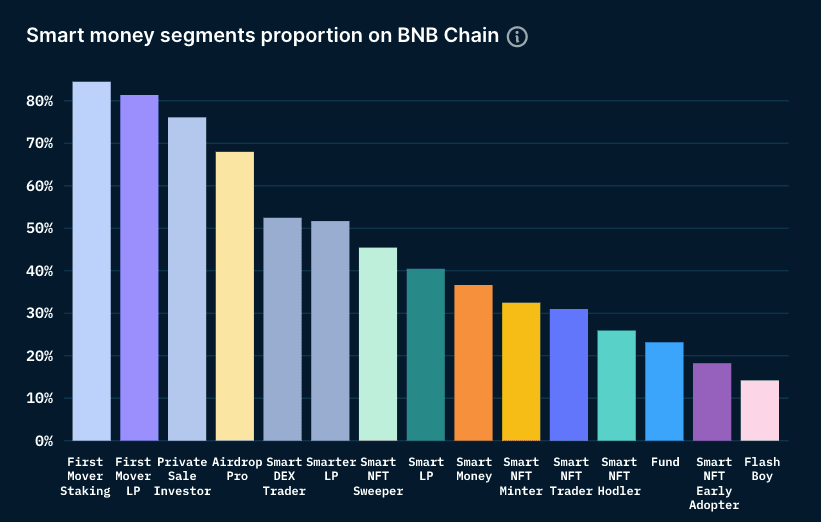
Source: Tytanid
The chart presented above illustrates the breakdown of Smart money addresses that are currently active in the BNB network. This data is to facilitate the perception of the proportion of segments in Ethereum addresses. These segments have been categorized based on the type of smart money.
It does come as no surprise that most of the smart money segments still belonged to players or liquidity providers (First Mover Staking, First Mover LP, Smarter LP, Smart LP). This is due to the higher APRC that are available in the chain for this type of activity. The NFT-related segments follow immediately. This, too, should not come as a surprise given the continued high growth in NFT online activity since the beginning of the first quarter. The funds were a smaller segment with an overlap of 23.2%.
Total value locked
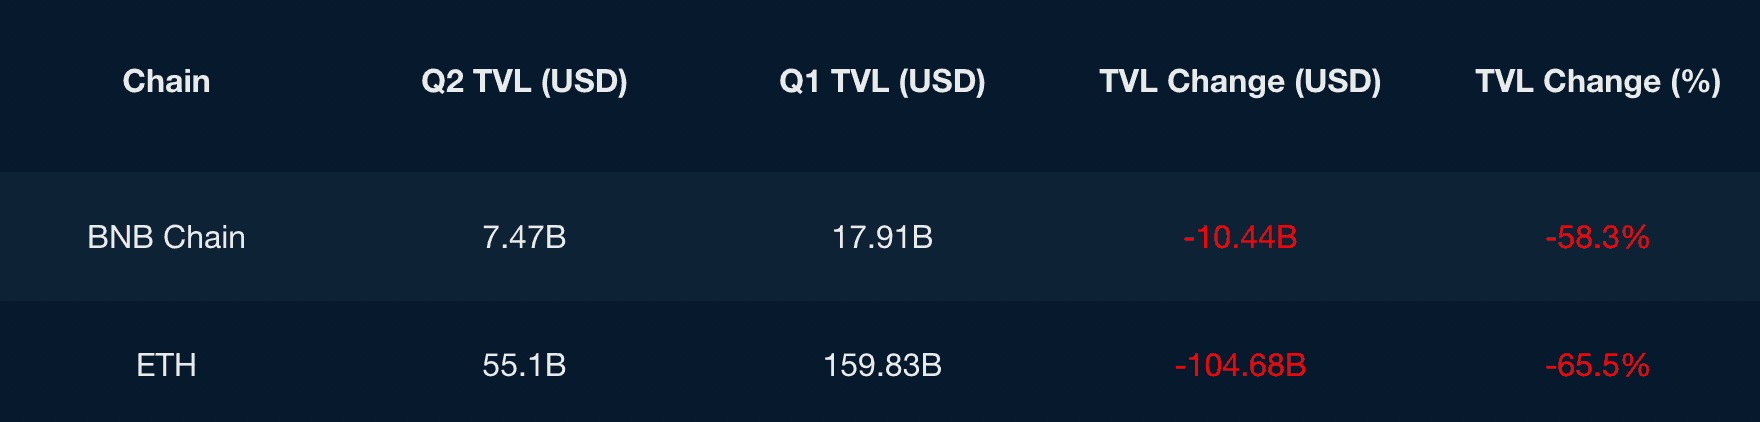
Source: DefiLlama
Based on the above TVL table, this figure continued to decline steadily throughout the quarter. This is due to the fact that the digital currency market is in a general downward trend. However, it should not be forgotten that the% drop in TVL was lower for BNB and not for Ethereum. In the case of the former, it was 58.3%, and in the case of the second-oldest cryptocurrency, the decrease was 65.5%.
Summary
Despite the deteriorating market conditions, BNB remained the most used chain in day-to-day transactions mainly due to low gas charges. BNB also actively participated in the financing of new projects in the second quarter, using its $ 1 billion ecosystem fund. Thanks to the huge dApps ecosystem, low transaction fees and speed of transactions, the BNB chain was still actively used by a wide range of users. The BNB network may have a chance to fly to the moon during the third quarter due to the introduction of BNB liquid staking, along with plans to implement BEP-126: Fast Finality Mechanism at BNB Beacon Chain, which aims to significantly reduce transaction finality time.